Federal Cloud NAICS and Product Service Code Spending Trends
Published: August 18, 2026
Federal Market AnalysisNAICS CodesSpending Trends
NAICS and PSC data provide insight about the federal cloud market.
Developed by the Office of Management and Budget (OMB) roughly 30 years ago, the North American Industry Classification System (NAICS) is a standard used by federal agencies to classify businesses by economic activity. The Small Business Administration uses NAICS-specific size standards to determine small business, 8(a), HUBZone, or other socioeconomic set-aside eligibility, while contracting officers use them to select size standards, according to business revenue or employee thresholds, for solicitations.
Businesses often use NAICS codes to identify their eligibility for potential contract opportunities and to size market niches by addressability. Product Service Codes (PSCs) provide another level of specificity by describing what the government is buying (e.g., products or services), whereas NAICS codes describe the industry classification of the vendor more generally.
Both NAICS and PSCs are important markers for the federal cloud market, but even though we collect this data at Deltek GovWin we have not, to my knowledge, ever provided an analysis of the data for industry. This week’s post offers such an analysis.
Cloud Spending by Top 25 NAICS Codes, FY 2023-2025
The table below shows spending on cloud solutions and services over the last three fiscal years by the top 25 NAICS codes.
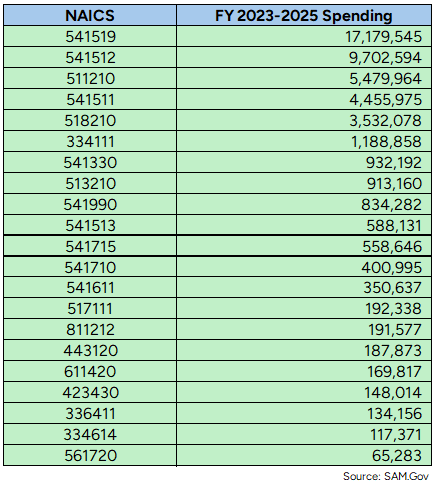
NAICS 541519 is the general classification for “Other Computer Related Services.” What is a bit surprising about it is that spending under 541519 totaled $6.0B in FY 2023 and declined to $5.7B in FY 2025. In part, this trend is likely because spending under 541512 Computer Systems Design Services, the next largest classification, increased from $3.1B in FY 2023 to $3.3B in FY 2025, and there is a degree of overlap in the kinds of work under each code.
Spending also increased under most of the other NAICS codes in this list except the following. They saw spending decreases:
- 541990 All Other Professional, Scientific, and Technical Services - $254M to $129M
- 443120 Electronics Stores - $95M to $58M
- 423430 Computer and Computer Peripheral Equipment and Software Merchant Wholesalers - $60M to $57M
Lastly, a relative newcomer on the list is NAICS 517111 Wired Telecommunications Carriers. Spending under that code only began in FY 2024 with $4.0M. BY FY 2025, spending totaled $188M.
Cloud Spending by Top 25 PSCs, FY 2023-2025
Turning to PSCs, here is what the data shows:
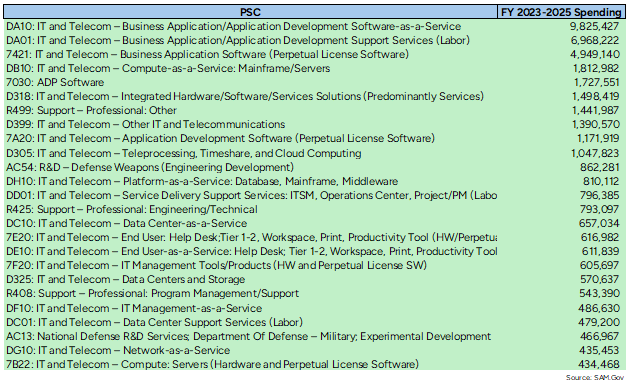
Seeing DA10 at the top of this list is not surprising given the dominance in spending on Software-as-a-Service (SaaS) identified by Federal Market Analysis several years ago. DA01 tracks well in this regard too. A lot of software related to system implementation falls under this PSC.
In general, the spending data under PSCs displays more volatility than that under NAICS codes. Altogether, spending increased under 18 of the top 25 PSCs from FY 2023 to 2025. The PSCs under which spending decreased are:
- 7421: IT and Telecom – Business Application Software (Perpetual License Software) - $1.9B in FY 2023, $1.3B in FY 2025
- R499: Support – Professional: Other - $469M to $340M
- D399: IT and Telecom – Other IT and Telecommunications - $572M to $421M
- R425: Support – Professional: Engineering/Technical - $469M to $340M
- 7030: IT Software - $741M to $265M. (PSC 7A21 has replaced 7030)
- R425: Support – Professional: Engineering/Technical - $308M to 198M
- AC54: R&D – Defense Weapons (Engineering Development) - $383M to $94M
Observations
Seeing spending go down under PSC 7A21 is perplexing given the dominance of SaaS consumption in the federal market. It suggests that software providers should not rely on a narrow spectrum of PSCs when trying to size markets. Agencies are clearly spending on SaaS under other codes.
The other surprise is declining spending under R425. Spending on engineering projects tends to be one of the stronger areas in the federal cloud market. A plausible explanation based on the data is that more of the spending that used to be reported under R425 is now reported under DA01.