Halfway Through FY 2017, How Much Are Agencies Spending on Contracts?
Published: April 06, 2017
Halfway through fiscal year (FY) 2017 most of the top 20 federal agencies are contracting at higher levels than they were at this point in FY 2016.
Fiscal year 2017 is experiencing an administration transition with new leadership across most agencies beginning to pursue a new set of priorities. Now that it is April and we are through the first and second fiscal quarters of FY 2017 we can look at the available federal contracting data to see how much federal departments have spent on contracts at the mid-point in the fiscal year and see what might be in store for us in the second half of FY 2017.
For context and comparison I looked the federal contract obligations reported for each federal agency for FY 2016, quarter by quarter, and then the first two fiscal quarters of FY 2017, which just closed at the end of March. To take a cautious approach to estimating what spending might look like for the remainder of FY 2017 I started with an arbitrary assumption that agencies would spend 90% of what they did in FY 2016 (baring any sweeping changes being implemented.) I then applied the relative proportions for each quarter’s obligations in FY 2016 to the corresponding quarters in FY 2017, adjusting for the reported dollars in Q1 and Q2 of FY 2017. The goal was to assess how each department spent across each quarter of FY 2016 and then estimate how the spending might shake out across the four quarters in FY 2017, assuming they will spend 90% of what they did in FY 2016.
Contract Obligations Compared
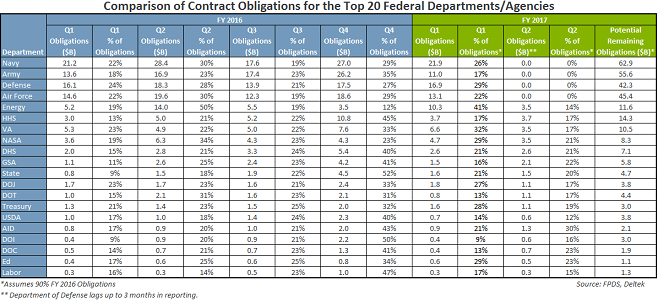
Historically, the twenty top-spending departments accounted for about 98% of all federal contract obligations, so I focused my attention on these departments. In FY 2016, these twenty accounted for $94.0 billion and $130.1 billion in total contract obligations for Q1 and Q2 respectively. For comparison, these departments reported $98.8 billion and $145.9 billion in contract obligations for Q3 and Q4 respectively for FY 2016. (See table below.) These FY 2016 quarterly amounts were all higher than the FY 2015 quarterly levels except for Q1, October-December of 2016, which was down $584 million compared to Q1 of FY 2015.
In FY 2017, these top twenty have reported $101.5 billion and $27.7 billion for Q1 and Q2 respectively, although DOD lags in their financial reporting by up to 90 days so Q2 spending is understated. Still, if these top agencies spend 90% of what they did in all of FY 2016 they will have more than $293 billion left to obligate in the remaining two quarters of this fiscal year.
Observations
- More than a dozen of these agencies reported higher Q1 FY 2017 obligations than for Q1 FY 2016.
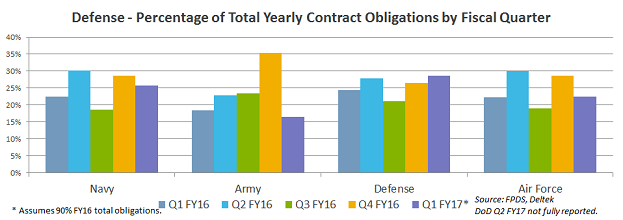
- Taken as a whole, the four defense components in Q1 FY 2017 have reported $2.4 billion less in obligations than they reported in Q1 of FY 2016, although Navy and Defense had slightly higher Q1 obligations in year-over-year. Army and Air Force each reported yearly declines of more than $1 billion.
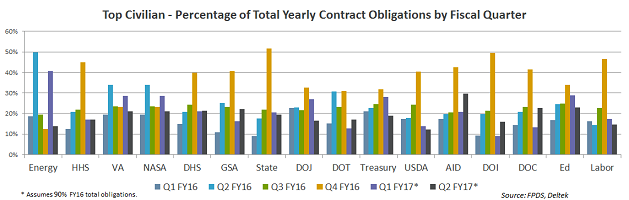
- Of the dozen Civilian departments that reporter higher Q1 obligations year-over-year, nine reported increases of 5% or more, and Energy, VA, NASA, DHS, State, Treasury, and Ed were even higher.
- A handful of departments have Q1 FY 2017 obligations lower than they did in Q1 of FY 2016 (Army, DOT, USDA, and Commerce).
- For Q2, by comparison, only one of these agencies – USAID reported growth in dollars obligated compared to a year ago. The State Department reported the about the same level of spending – $1.5 billion in Q2 for both years. (The DOD lags in their reporting by 3 months.)
A graphical representation of the relative proportions of each department’s contract spending gives a sense of seasonality and/or changes from year to year. Due to the sheer number of departments I have split these into Defense and Civilian segments. This further highlights the quarterly seasonality as well as year-to-year changes for Navy, Army, and Defense, as well as for most Civilian departments, especially Energy, HHS, VA, NASA, and Treasury. (See charts below.)
This type of macro-level analysis is useful in getting a general sense of quarterly and yearly patterns across the departments. Of course, the remaining FY 2017 obligation estimation depends on the 90% assumption described above. When I ran these numbers last year looking forward for FY 2016 estimates, this approach pointed to roughly $257 billion in combined FY 2016 Q3 and Q4 obligations among the top twenty departments. Now, a year later, the final FY 2016 Q3 and Q4 data shows that actual obligations came in at $249.5 billion, so the 90% assumption was just a tad optimistic by about $7.5 billion, or 3%. However, the difference turns out to be a matter of timing rather than magnitude. The final FY 2016 Q1 obligations given above come in at $3.4 billion higher than what agencies reported originally at this time last year for that same quarter. Further, the FY 2016 Q2 dollars above are about $90 billion above what agencies reported at this time last year – each difference reflecting revisions due to lagging obligation data being added later in the year.
The bottom line is that we could likely see close to $300 billion in contract spending in the second half of FY 2017. The real question is how those dollars will be distributed across the various departments and agencies.