Half-way Through FY 2016, Pt.2 – How Much Are Agencies Spending on Information Technology?
Published: April 13, 2016
With the 2015 Bipartisan Budget Agreement (BBA) setting the foundation for FY 2016 enacted budgets agencies have been moving forward with their contracted spending, including information technology (IT). So at the mid-point in the fiscal year, we can begin to see how agencies are doing at getting their IT contract dollars obligated and possibly what we might we expect for the second half of FY 2016.
Last week, I looked at the total market contract obligations at the mid-fiscal-year point. This week I’ll look specifically at contracted IT spending using a similar approach – looking at year-to-year comparisons for Q1 and Q2 of FYs 2015 and 2016 and then seeing what it looks like if in FY 2016 agencies spend 90% of what they spent in FY 2015.
In the latest federal FY 2017 IT budget request, OMB reported the total enacted FY 2016 IT budget to be about $81.5B, which is $1.1B (1.4%) more than the $80.4B agencies spent in FY 2015. So this 90% threshold that I am using for potential FY 2016 spending, while not a particularly scientific approach, might be playing it safe.
IT Contract Obligations Compared
For Information Technology spending in FY 2015, the twenty top-spending departments accounted for $69.2B or 97%, of the total $71.5B in total federal IT contract obligations. These twenty agencies accounted for $10.8B and $15.2B in FY 2015 Q1 and Q2 obligations respectively. For comparison, these departments reported $17.0B and $27.7B in IT contract obligations for Q3 and Q4 respectively for FY 2015. (See table below.)
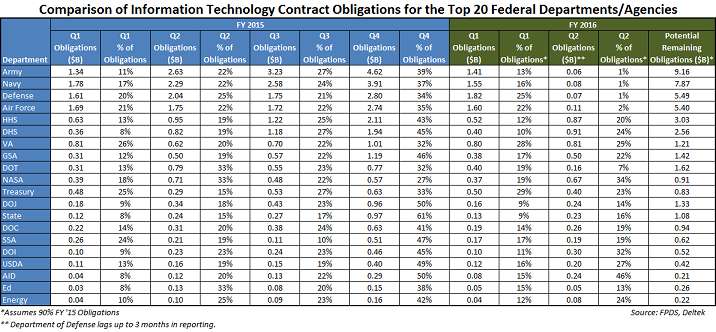
In FY 2016 to date, these top twenty departments have reported $11.0B and $6.9B for Q1 and Q2 respectively, although DoD lags in their contract data reporting by up to 90 days so Q2 is significantly understated. Nonetheless, in FY 2016 if these top agencies spend 90% of what they did in FY 2015 they will have more than $46B left to obligate in the remaining two quarters of this fiscal year.
Observations
- Defense – The defense components are a mixed bag with regard to comparing their reported Q1 IT contract spending for FY 2015 and FY 2016. (Last year all the components reported lower spending in Q1 of FY 2015 compared to Q1 of FY 2014.) For FY 2016, the Army and Defense Agencies have both spent more in Q1 than they did in Q1 of FY 2015, up +6% and +13% respectively. Mirroring this in the opposite direction are the Air Force and Navy which spent -6% and -13% less respectively in Q1 of FY 2016 compared to FY 2015. Total Defense IT spending for Q1 is down $32M in FY 2016 versus FY 2015. The natural implication for Army and Defense-wide is that their total FY 2016 contacting will be more front-loaded in the first half of this year versus last year unless they spend significantly more in the remaining quarters to rebalance the quarters. The converse is true for Air Force and Navy. Due to the DoD’s data reporting lag, which could take up to 90 days to settle out, we won’t know what Q2 of FY 2016 really looked like until June or July. As is fairly typical, when they update their spending data they’ll need to post more than $8B in IT contract spending to keep pace with Q2 of FY 2015.
- Civilian – Among the civilian agencies in the top twenty, five have reported lower Q1 FY 2016 obligations compared to Q1 FY 2015. HHS, NASA, Justice, Commerce, and SSA reported drops of -18%, -6%, -11%, -14%, and -34% respectively for Q1. On the plus side, DHS (+10%), GSA (+25%), Transportation (+31%), Treasury (+4%), State (+7%), Interior (+6%), Agriculture (+11%), and AID (+73%) all saw year-to-year growth in Q1 spending from FY 2015 to FY 2016. The VA is right about on the same pace year-over-year. The Q2 comparison from 2015 to 2016 are somewhat more varied, with DHS (+11%), VA (+30%), Treasury (+38%), Interior (+29%), Agriculture (+25%), and AID (+103%) showing gains and HHS (-8%), Transportation (-80%), NASA (-6%), Justice (-30%), State (-6%), Commerce (-17%), and SSA (-10%) reporting year-to-year declines and GSA holding steady. It is noteworthy that DHS, GSA, Treasury, Interior, Agriculture, and AID reported year-to-year gains for both Q1 and Q2 and HHS, NASA, Justice, Commerce and SSA reported reductions for both quarters. Overall, for the first half of fiscal 2016 DHS is up 11%, VA is up 13%, GSA is up 10%, Treasury is up 17%, Interior is up 22%, Agriculture is up 20%, and AID is up 95% over last year. HHS is down 12%, Transportation is down 49%, NASA is down 6%, Justice is down 24%, Commerce is down 16%, and SSA is down 23%.
The passage of the FY 2016 appropriations and the 2015 BBA that eased sequestration fears, raised many civilian budgets, and established some degree of expected certainty may be fueling some of the above civilian agencies’ spending. By the same token, agencies reporting contracting reductions – like Transportation, Justice, NASA, and SSA – submitted IT budgets for FY 2017 that indicated reductions in their FY 2016 IT budgets from FY 2015, although this is not the case for HHS, State, and Commerce.
When I ran these IT numbers using the 90% assumption last year, I came to approximately $45B in potential Q3 and Q4 IT contract spending among the top twenty departments for FY 2015. The final numbers came in around $43.2B, so the 90% assumption was not too bad an estimation, but since a 10% decline was built in it shows that many agencies are working to achieve savings in their IT spending.