Contracting Trends at DHS in FY 2017 Point to Future Growth
Published: February 08, 2018
Contracting TrendsForecasts and SpendingDHSSmall Business
Federal contract spending at the Department of Homeland Security (DHS) for fiscal year (FY) 2017 reveals trends and takeways for the future.
Contracted Spending Trends
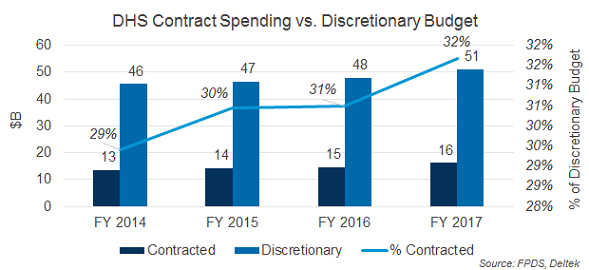
For fiscal year (FY) 2017, DHS had a discretionary budget of approximately $51.1 billion, of which they spent $16.2 billion on contracted goods and services of all types. That accounts for about one third of DHS’s discretionary budget. Over the last four years the trend for both discretionary budgets and the relative proportion of those budgets that DHS spent on contracts has been on the rise. (See chart below.)
Looking deeper at the specific contracted areas where DHS spent the most in FY 2017 reveals the types of spending required to support the broad and diverse missions of the various component agencies and directorates. These five largest categories account for nearly $13 billion and almost 80% of DHS’s total contract spending in FY 2017. (See chart below.)
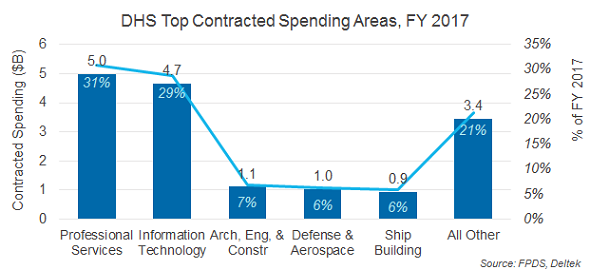
Of these five categories above three saw year-over-year increases from FY 2016 to FY 2017 – Professional Services (+12%), Architecture, Engineering and Construction (+25%), and Ship Building (+108%) while the Information Technology and Defense and Aerospace categories saw declines of -3% and -29% respectively. Still, even with some yearly fluctuation these decliners for FY 2017 account for $4.7 billion in contracted spending.
Small Business Contract Performance
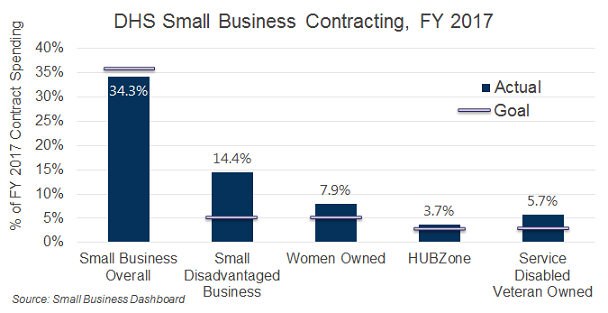
Like other federal departments and agencies, DHS has goals set by the Small Business Administration (SBA) for the percentage of their contracts which agencies must award to small businesses – both overall and among various types. For FY 2017, DHS had an overall goal of 35.5%, up from 33.5% in FY 2016 and 32% in FY 2015, (both of which were met for those years.) Goals for Small Disadvantaged Business and Women Owned business each remained consistent at 5% and the same is true for HUBZone and Service Disabled Veteran Owned businesses set at 3% each. While DHS met the individual component goals for FY 2017 it fell short of the 35.5% overall goal. (See chart below.)
Information Technology – Top Vendors
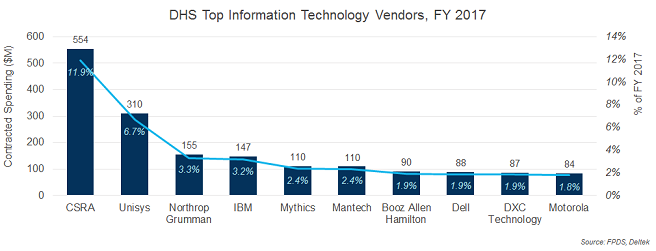
Turning specifically to Information Technology (IT) vendors at DHS shows which ones were most successful at winning prime contracts in FY 2017. These top ten vendors account for more than $1.7 billion in contracts, which represents more than 37% of DHS’s FY 2017 IT contracted spending. Only one vendor – CSRA – accounts for more than 10% of DHS’s IT contracts, while most of the others fall in the 2-3% range. (See chart below.)
Looking Forward
This recent historical data points to upward spending trends within a fiscal environment that is complex and fraught with challenges. Even with fiscal pressures and sequestration concerns both discretionary budgets and contracted spending have continued to grow, due to the critical nature and expanding demands of the diverse missions among DHS components. Each of the largest contracting areas (Professional Services, IT, etc.) will experience yearly spending fluctuations, but each have shown a general trend toward increased spending at DHS.
The Trump Administration's national security priorities point to sustaining this trend into future years. We will know even more about what to expect in future spending priorities once the FY 2019 budget request is released in the coming days.