Fourth Quarter Spending Spree – Which Market Segments Have the Money?
Published: August 30, 2018
Federal Market AnalysisContracting TrendsForecasts and Spending
Five major market segments historically account for more than $100 billion in federal Q4 spending.
With the month of September upon us and the peak of the traditional “federal busy season” sprinting to the end of fiscal year (FY) 2018 federal contractors and suppliers are eager to know where there might be federal departments looking to purchase what they offer. A look at historical federal spending data for five key market segments – Architecture, Engineering and Construction, Defense and Aerospace, Information Technology, Professional Services and Research and Development – gives us a pretty good clue.
Notable patterns emerge when looking at contract obligation data submitted by federal departments and agencies for the three most recent fiscal years from FY 2015 to 2017.
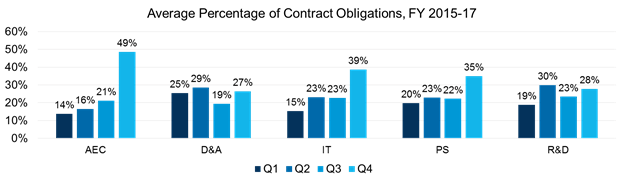
Average spending across the four quarters of the federal fiscal year from FY 2015 to 2017 varies among Architecture, Engineering and Construction, Defense and Aerospace, Information Technology, Professional Services and Research and Development. (See chart below.)
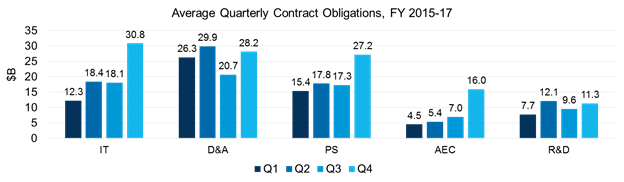
Looking at how this panned out in actual obligation dollars shows that the IT holds the first place position for total Q4 obligations over the last three years, followed closely by Defense and Aerospace and Professional Services. (See chart below.)
Top Three Segments for Q4 Proportional Spending
While the magnitude of spending varies significantly among each of these segments there are three segments that registered more than a third of their yearly dollars in the fourth quarter.
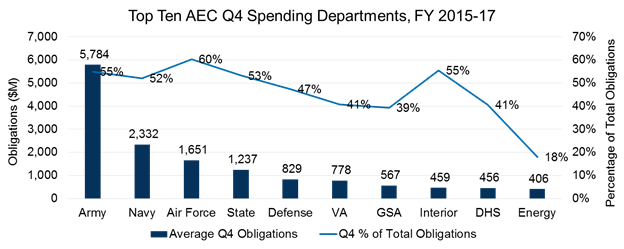
Architecture, Engineering and Construction – In a segment where nearly half of all yearly contract spending occurs in Q4 these top spending departments stand out for both magnitude and proportion of Architecture, Engineering and Construction spending. From FY 2015 to 2017, Q4 spending at these top ten departments account for more than 90% of Q4 spending and nearly 45% of all AEC spending over the three-year period. (See chart below.)
Information Technology – IT is the largest segment dollar-wise and the second strongest segment for percentage of clustered Q4 spending from FY 2015 to 2017. Spending in this segment is less centralized within a few departments with more of them averaging more than $1B for the quarter. These top ten average a combined $25B in spending each year, accounting for more than 80% of Q4 spending and more than 30% of all IT spending over the three-year period. (See chart below.)

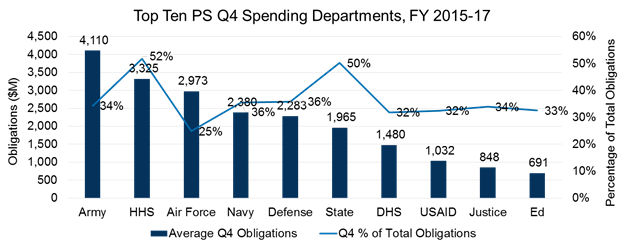
Professional Services – Government-wide, fourth quarter spending accounts for 35% of total Professional Services spending on average from FY 2015 to 2017. Among the top ten PS buyers over the period there is significant variance in the relative percentage of total yearly spend that falls in Q4, ranging from 25% to 52%. These top ten average a combined $21B in spending each year, accounting for almost 80% of Q4 spending and about 27% of all PS spending over the three-year period. (See chart below.)
Conclusion
So far in FY 2018 spending appears to be very strong overall, although the available data is incomplete for some departments, especially the Department of Defense. If the historical pattern holds and the 2018 data trend stays true we could very well see one of the biggest Q4s yet.