U.S. State Department COVID-19 Contract Spending Analysis
Published: June 04, 2020
Federal Market AnalysisContracting TrendsCoronavirus (COVID-19) PandemicSpending TrendsSTATE
Federal contracting data shows that the U.S. Department of State has spent nearly $98 million to date for COVID-19 response activities.
Key Takeaways
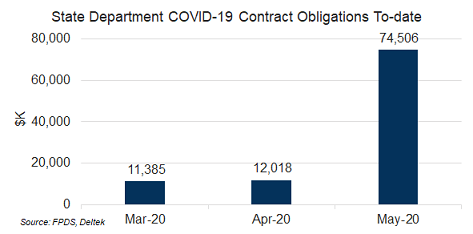
- The U.S. Department of State has spent almost $98 million to date for COVID-19 response contracts, 75% of which were awarded in May.
- More than 40% of the State Department’s COVID-19 spending to date was for chartered repatriation flights and ground support services contracts, with another 35% centering on Architecture, Engineering and Construction (AEC) services.
- Medical & Scientific Equipment and Information Technology account for roughly 15% and 7% respectively of the $98 million State has spent so far.
Department of State COVID-19 Contract Spending
A snapshot of what the U.S. Department of State (DOS) has reported for their contract obligations to date gives an idea of the kinds of contracts they have awarded so far, for what types of goods and services and with which companies. Contracted coronavirus response activities using the CARES Act and other stimulus funds are required to be flagged under the COVID-19 National Interest Action (NIA) in the Federal Procurement Data System (FPDS). This allows some visibility and oversight into how federal response dollars are being spent.
To date, the DOS has obligated $97.9 million over the last three months, with more than 75% of that coming in May, the second full month of COVID-19 contracting so far under the NIA. (See chart below.)
For the Primary Requirement for these contracts – the main type(s) of products and/or services being procured – the spending data shows that the State Department has been focusing more than 40% of their COVID-19 spending to date on Professional Services contracts and another 35% centering on Architecture, Engineering and Construction (AEC) services. Medical & Scientific Equipment and Information Technology account for roughly 15% and 7% respectively of the $98 million DOS has spent so far. (See chart below.)

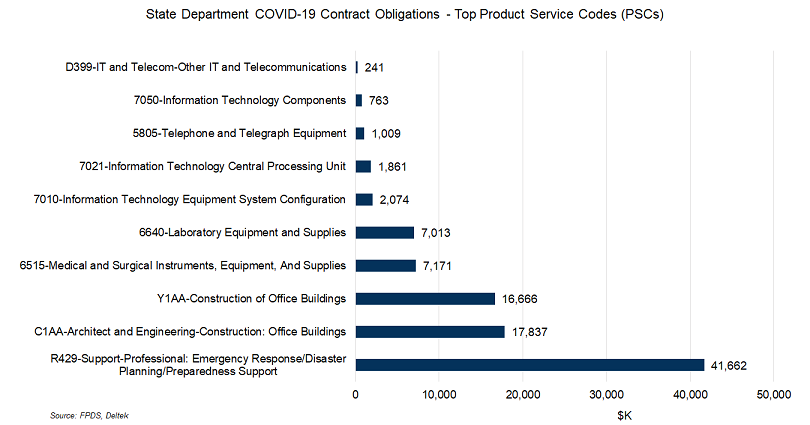
Looking into the most frequently used Product Service Codes (PSC) reported for DOS contract obligations so far indicates that the data aligns well to the Primary Requirement areas above. The top five PSCs carrying the largest portion of obligations – more than $90 million of the $98 million to date – account for more than 90% of total obligations. The next five account for another $6 million or 6%, resulting in the top ten PSCs covering 98% of State’s obligations through May. (See chart below.)
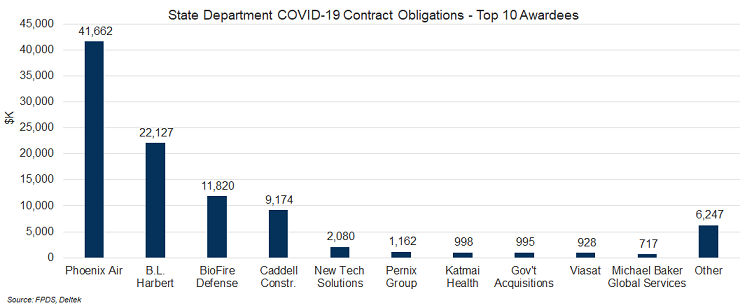
Consistent with the concentration of dollars around the kinds of services and goods that the State Department has procured to date, the number of awardees is highly concentrated – with the top five firms accounting for nearly 90% of contract dollars to date. One firm, Phoenix Air Group accounts for more than $41 million (43%) of the $98 million the DOS has awarded to date. The rest of the “top 10” awardees account for about $50 million or 51% of award dollars, with the remaining 50 firms that have received awards in the Other grouping accounting for $6.2 million or 3.5%. (See chart below.)
The $41 million awarded to Phoenix Air is for chartered repatriation flights and ground support services in April and May. The B.L. Harbert contracts are for Architecture, Engineering and Construction (AEC) services and the BioFire Defense contracts are for laboratory and medical equipment and supplies.
The Place of Performance (POP) where State has been spending its COVID-19-related dollars is fairly well concentrated. The top five locations –account for 95% of contact dollars to date. The state of Georgia alone accounts for more than 40% of obligations. The Outside the Continental U.S. (OCONUS) category denotes an aggregate of all overseas locations and represents more than a third of the contract obligations. (See chart below.)

Digging a bit further into those OCONUS locations reveals that almost two-thirds of those contract dollars were for work performed in the top three locations of Lebannon, Iraq and Honduras which together make up more than $22 million in obligations. The remaining five countries account for a total $10.6 million or 30% of the OCONUS category. (See chart below.)

For Preference Programs and set-asides to small businesses mission the State Department has awarded just over 50% of these contract dollars via Small Business Set Asides and other Preference Program types. The remaining 49% either did not use set-asides or was unreported. (See chart below.)

As the federal pandemic response continues over the coming months Congress is considering additional economic stimulus and agency funding for ongoing response efforts. Depending on the scope and size of any future funding packages – and the pace of these provisions – The State Department may be called upon to engage in further efforts, which would likely result in continued reliance on industry support and future contract spending.