A Possible Contracted Spending Scenario for the Rest of FY 2014
Published: April 09, 2014
USDAUSAFARMYDOCDEFENSEEDUCDOEForecasts and SpendingHHSDHSDOIDOJDOLNASANAVYSTATEDOTTREASVA
Can you believe that we are half way through fiscal year 2014? Let’s take a look at the data to see what can we tell so far about how much federal departments have spent on contracts at the mid-point in the year and see what might be in store for us in the second half of FY 2014.
When I looked at the mid-fiscal-year spending rates last year, I proposed what I felt was reasonable approach to projecting potential contract obligation rates for the remaining two fiscal quarters. This year I again set a baseline that in FY 2014 agencies will obligate at least 90% of what they did in FY 2013 to drive my general projections for what they might spend on contracts in the second half of the fiscal year. See my previous blog for a more detailed explanation of my approach.
Contract Obligations Compared
The twenty top-spending departments account for $122.4B in combined Q1 and Q2 obligations for FY 2014. If they spend 90% of what they did in FY 2013 they will have $285.5B left to obligate in the remaining two quarters of this fiscal year. (See table below.) Under that assumption, the remaining federal departments and agencies would account for roughly $4.5B for Q3 and Q4, reaching the overall $290B mark for the second half of the year.
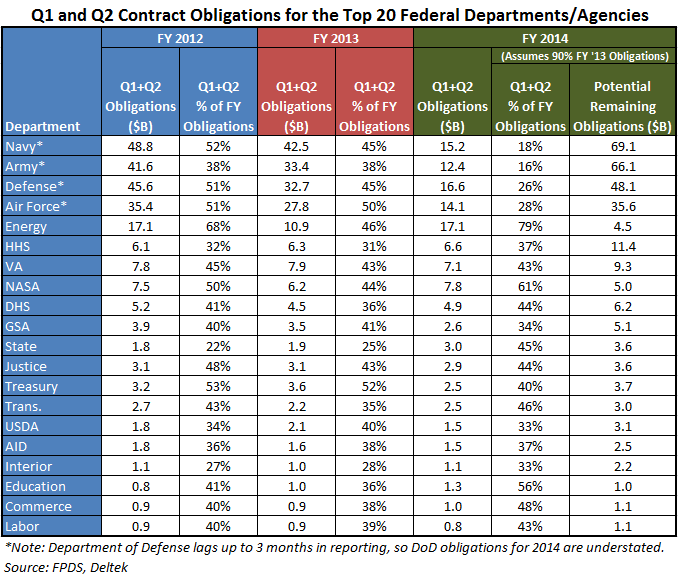
Observations
- Only a few departments have a FY 2014 Q1 and Q2 obligation rate lower than they did in FY 2013, suggesting that their obligation rates may be higher than last year at this time, depending on total final obligations.
- At this point in FY 2013, each defense branch had reported at least $3 billion more in obligations than they have reported for FY 2014, even under sequestration
- Navy has reported $15.2B for FY 2014, compared to $25.3B at this point in FY 2013
- Army has reported $12.4B for FY 2014 18B, down from $17.8B for FY 2013
- Defense Agencies have reported $16.6B for FY 2014, compared to $19.1B for FY 2013
- Air Force has reported $14.1B, compared to $17.3B for FY 2013.
- Seven of the twenty departments above saw drops of 5% or more from FY 2012 to FY 2013, five of which are civilian agencies, i.e. Energy, NASA, DHS, Justice, and Education. But without exception each of these departments has reported increases in the first two quarters of FY 2014 compared to FY 2013. Energy, NASA, and Education each show increases of 15 percentage points or greater.
- Energy’s yearly cyclicality continues. During Q1 and Q2 the DoE tends to obligate roughly 45% and 75% alternately from year to year. Looking back at FY 2011 reveals that they spent $11.1B in the first two quarters, which accounted for 45% of their $25.1B total FY 2011 obligations.
- NASA also reveals cyclicality in its contracting. In FY 2011 NASA reported $6.4B in combined Q1 and Q2 obligations accounting for 41% of their $15.4B total obligations for that year. Looking at the chart above we can see an oscillation in NASA’s obligations since then with $7.8B reported so far in FY 2014. Depending on whether my 90% assumption is pessimistic regarding their final spending will determine whether they have between 40-50% of their budget yet to obligate this fiscal year.
Implications
Some of the year-to-year changes shown above may be due to the appropriations levels and funding priorities that these departments received under the FY 2014 Omnibus funding bill passed earlier this year. However, what these changes more likely indicate is the impact of agencies having actual budgets earlier in the fiscal year, compared to having full-year continuing resolutions that freeze priorities and limit flexibility.
How useful or accurate this kind of macro-level estimation is depends in large part on its main assumptions. Last year this approach pointed to roughly $300 billion in potential combined FY 2013 Q3 and Q4 obligations. The final data shows that actual obligations came in at $265 billion, so my 90% assumption was optimistic in the age of uncertainty, sequestration, and year-long continuing resolutions. Actual combined Q1-Q2 obligations among the top twenty departments declined from $237.1 billion in FY 2012 to $194.0 billion in FY 2013, an 18% drop.
So far in FY 2014, these same departments have reported combined Q1 and Q2 obligations of $122.5 billion, BUT the four largest spenders – the defense branches – have not fully reported their Q2 data. Looking at the civilian departments only give us $65.7 billion, $57.6 billion, and $64.2 billion for FYs 2012, 2013, and 2014 respectively, so FY 2014 is running only 2% below FY 2012 levels and is nearly 12% ahead of FY 2013. We’ll just have to wait and see what comes from DoD.